
Benford's Law in crates.io Download Data
Brief investigation of download number of Rust crates on crates.io considering Benford's law.

Benford’s law describes the distribution of significat digits in certain number based datasets. The law states that lower digits have a higher occurrence than later ones. For example the leading digit 1 is encountered in approximately 30% of numbers, leading digit 2 in 18% of cases and only roughly 5% of numbers start with digit 9. The frequency of a leading digit d for base 10 numbers is given by the following formula for datasets adhering to Benford’s law:
Such datasets can be found throughout many areas like accounting, sales data or sport statistics. Typically datasets derived from growth processes can be observed to follow the described law.
In the following I will investigate whether data points in crates.io data can be found to follow Benford’s law. crates.io is the go-to registry to pull and distribute dependencies from when developing Rust software. Fortunately, crates.io data can be obtained easily either via API or by a daily created database dumb. As I would like to further investigate the data in future and not stress the API every time I decided to utilize the database dumb.
After downloading, spinning up a Postgres docker container and running the data import scripts the data can be investigated using SQL queries. For a detailed instructions on how to do that, check here. The table downloads provides the number of downloads for each of the crates up to the date the dump has been created. With the following query the count of each leading digit of crate downloads is computed:
select
cast(cd.downloads as varchar(1)) as leading_digit,
count(*) as count
from crate_downloads cd
group by leading_digit
order by leading_digit
cast(cd.downloads as varchar(1)) computes the leading digit of the respective crate download number. Computing the relative number of occurences and the expected frequencies according to the Benford’s law the following table is created from the query results. Note that, crates with zero downloads have been omitted to simplify the visualization. Also zero as a significant leading digit is not considered in the usual formulation of Benford’s law. For the analysis the data dump from 04.01.2025 has been used. In this there were two crates with zero downloads which have been omitted.
Leading Digit | Observed frequency | Expected frequency
1             | 0.3185             | 0.3010
2             | 0.1668             | 0.1761
3             | 0.1069             | 0.1249
4             | 0.0774             | 0.0969
5             | 0.0661             | 0.0792
6             | 0.0549             | 0.0669
7             | 0.0503             | 0.0580
8             | 0.0797             | 0.0512
9             | 0.0795             | 0.0458
Using a short Rust program utilizing the plotters crate the data as provided by the query is depicted in the following plot. As a comparison the expected number of leading digits according to Benford’s law as stated in formula (1) is provided by the blue bars.
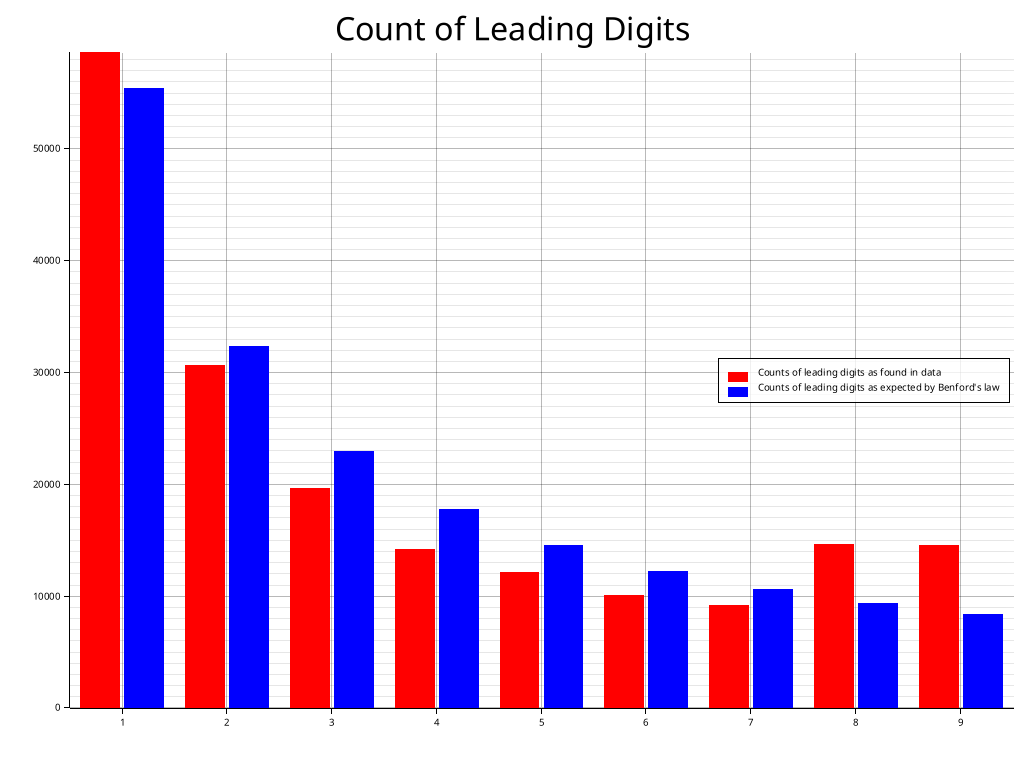
In total there were 167,217 crates for which the download numbers have been investigated. Looking at the at the table and the plot it can be seen that in fact most leading digits of download numbers have a descending count coming close to what is described by Benford’s law. However, apperently there seems to be some anomaly for the digits 8 and 9 as they occur more frequently than expected and also than smaller digits like 5, 6, 7.
Note, that visually there might be some resemblance to Benford’s law. However, proving with statistical significance that the dataset actually follows Benford’s law might turn out difficult. Using a Chi-squared test the sample size might be too big and additionally I would expect the fit not to be good enough in general to actually adhere to Benford’s law.
In case you want to play around with the data or the plotting functionality all code and steps to recreate the investigation is provided as GitHub repository.